 Online: 13716
Excel > Charts
Scatter chart in Excel
How to create scatter chart in MS Excel?
In last post, we learnt about 2D & 3D Area Chart in Excel. In this post, we shall learn Scatter chart in Excel.
Scatter chart
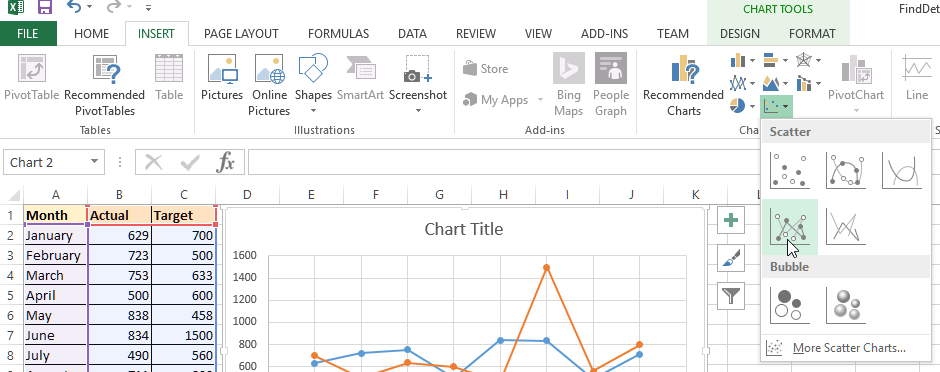
To insert Scatter chart, click on INSERT menu and click on Scatter chart command button from the ribbon as displayed below. Do remember to select data to create chart before following these steps.

A scatter chart appears at the center of the page, now hold the chart and drag to desired location.
As on the other charts, we can style and filter Scatter chart too.
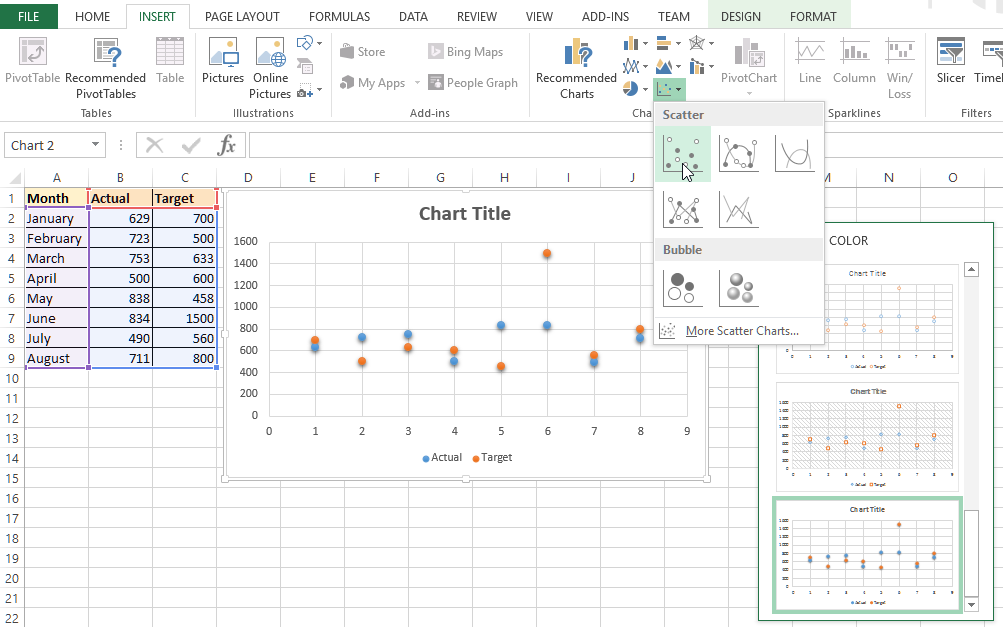
Scatter chart with markers only
To bring only markers on the scatter chart, select that chart type from the Scatter command button dropdown. We can select variance of only marker chart by clicking on Style button at the top-right corner of the chart.

Thanks for reading!
Views: 9242 | Post Order: 51


