 Online: 14034
Excel > Charts
2D & 3D Area Chart in Excel
How to create 2D and 3D Area chart in Excel?
In last post, we learnt how to create 2D & 3D Bar Chart in Excel. In this post, we shall learn how to create an Area chart in Excel.
2D Area Chart
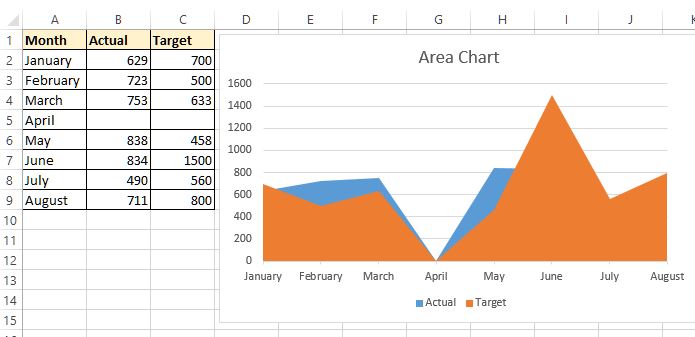
Select the data for which we want to draw a chart, now go to 'INSERT' menu and click on 'Area' chart command button from the 'Charting' group on the ribbon and select desired type of Area chart as shown below.

An Area chart appears at the center of the screen. Now drag it by holding with mouse to move to the desired position on the spreadsheet.

To apply style, filter and customize the element of the chart, follow the steps described here.
3D Area Chart
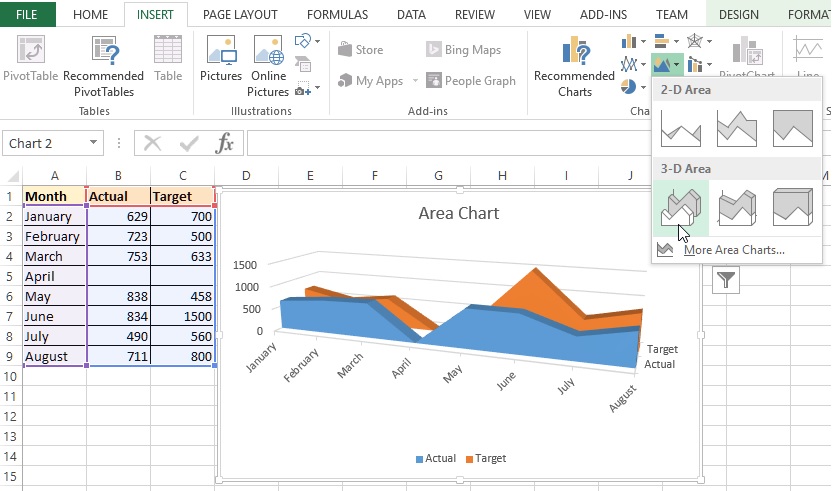
To create 3D Area chart, follow the same step as above but from the 'Insert Area Chart' dropdown, select 3-D Area chart type as shown in the picture below.

A 3-D chart appears on the screen. To modify the style, filter the data and customize elements followthis post.
Thanks for reading, hope this post was useful. Do share with your friends and colleagues!
Views: 12205 | Post Order: 50


