 Online: 18120
Excel > Charts
Column chart in Excel
How to create a column chart in MS Excel?
In the last post, we learn how to create secondary chart in Excel. In this post we shall learn how to create column chart in Excel.
2-D Column chart
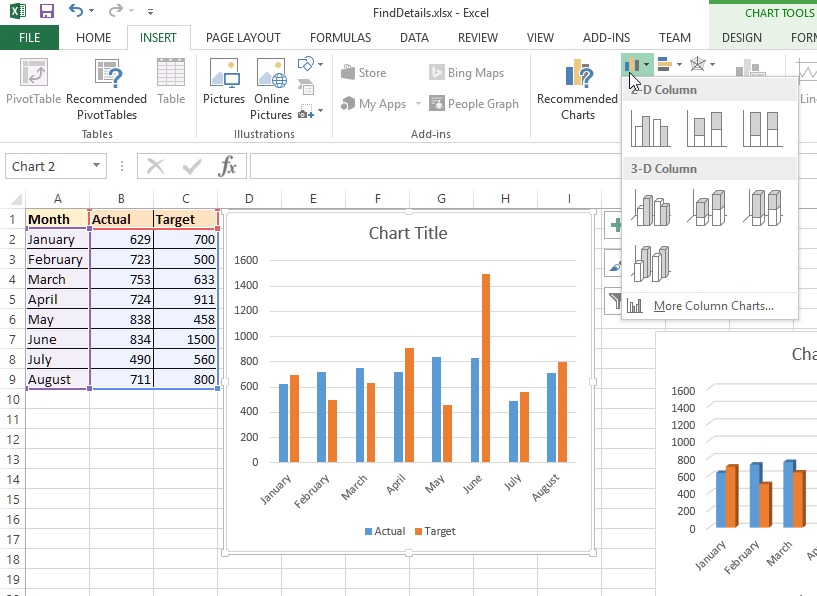
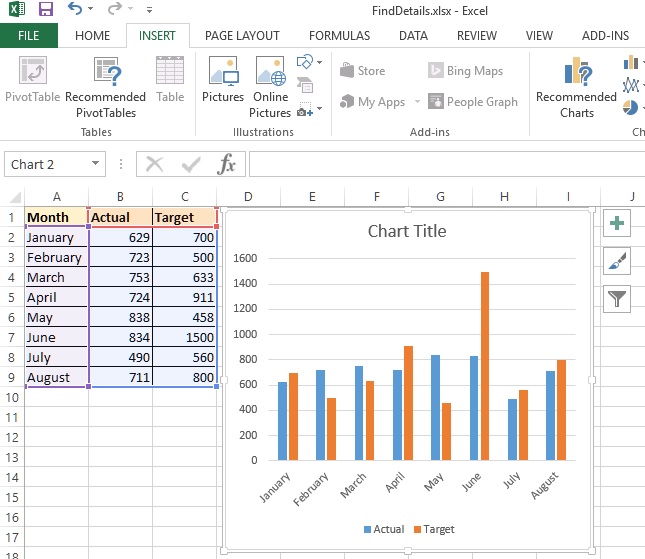
To create a 2-D column chart in Excel, select the data for which chart has to be created. Go to 'INSERT > Insert Column Chart'. A chart appears as shown below.

On the 'Insert Column Chart' dropdown, there are many variance of 'Column Chart', we can select any of them to create respective chart.

3-D Column chart
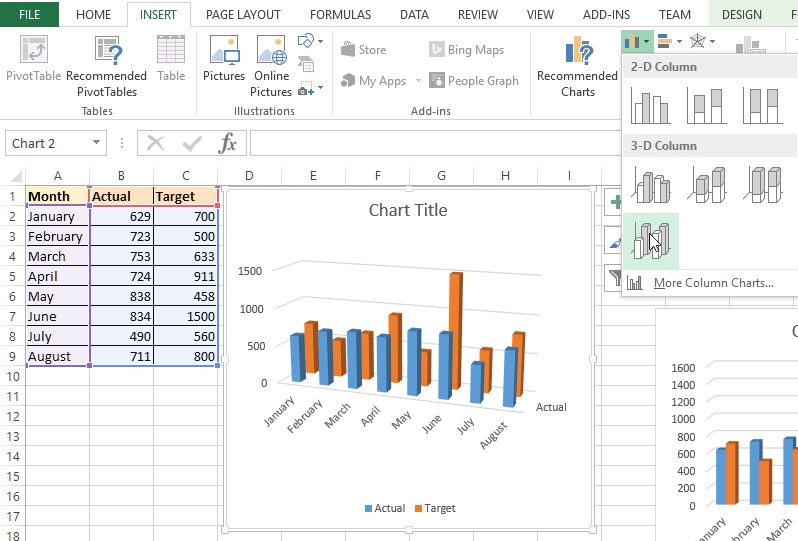
To create 3-D column chart, select chart type of 3-D under 'Insert Column Chart' dropdown.

To know how to modify chart axis, labels etc. visit this post.
Views: 5434 | Post Order: 45


