 Online: 15078
Excel > Charts
Line chart in Excel
How to create a line chart in MS Excel?
In last post, we learnt how to create Column chart in Excel. In this post, we shall learn how to create a line chart in MS Excel.
2-D Line Chart
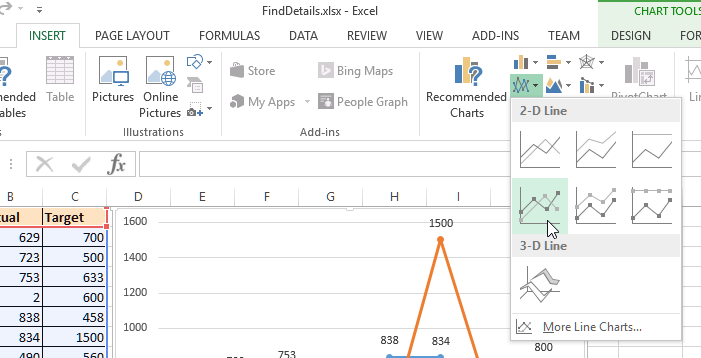
To insert Line Chart in MS Excel, Select the data to generate Line chart and then go to 'INSERT' menu and click on 'Line Chart' dropdown from 'Charts' group. Select desired type of Line chart from the dropdown as displayed below.

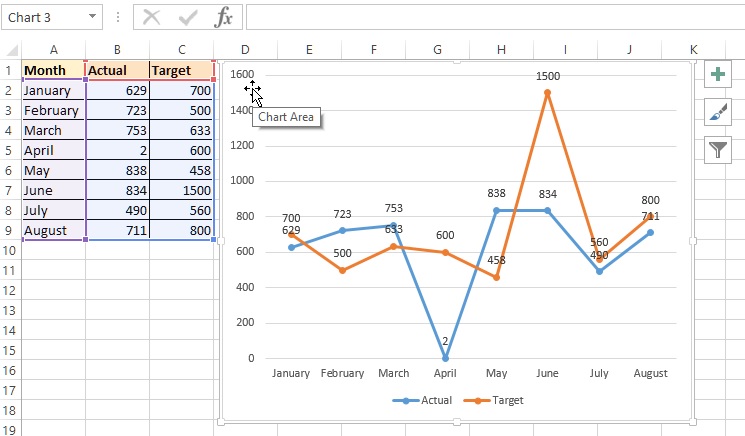
In this case, we have selected 'Line with Markers' chart that looks like below.

3-D Line Chart
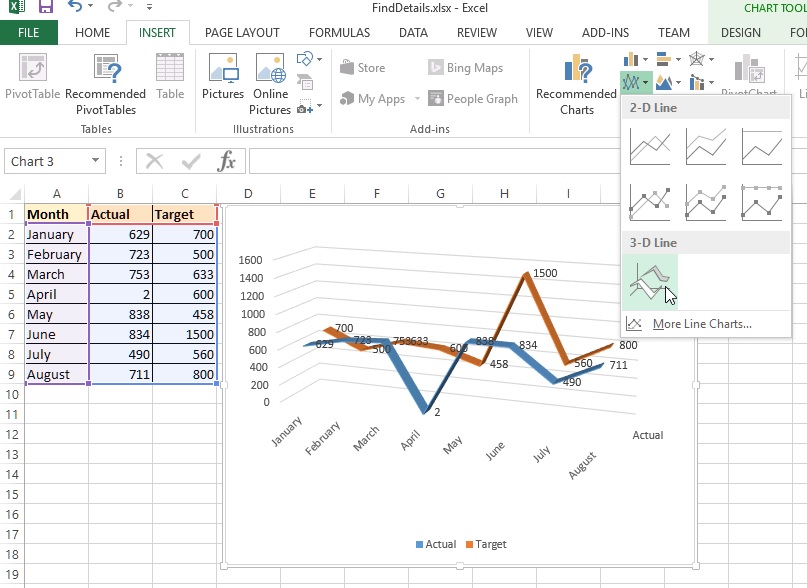
To create 3D Line chart, select '3-D Line' chart option from the dropdown and it will draw 3D Line chart as displayed in the picture below.

Thanks for reading, if you liked it please share to your friends and colleagues!
Views: 7179 | Post Order: 46


