 Online: 28356
Excel > Charts
Change chart type, switch row/column in Excel
How to change chart type and switch row/column for Excel chart?
In last post, we learnt about Chart axes, legend, data labels and trendline in Excel. In this post, we shall learn how to change chart type, switch rows to column and vice-versa.
Change Chart Type
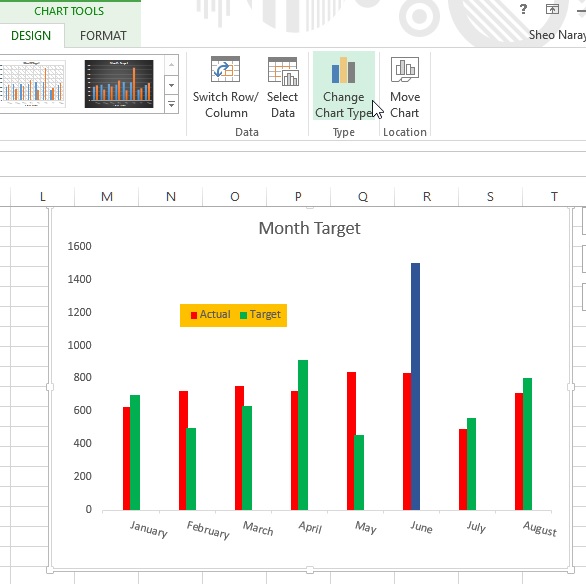
To change the chart type for chart already built, simply select the chart by clicking and then select 'DESIGN > Change Chart Type' command.

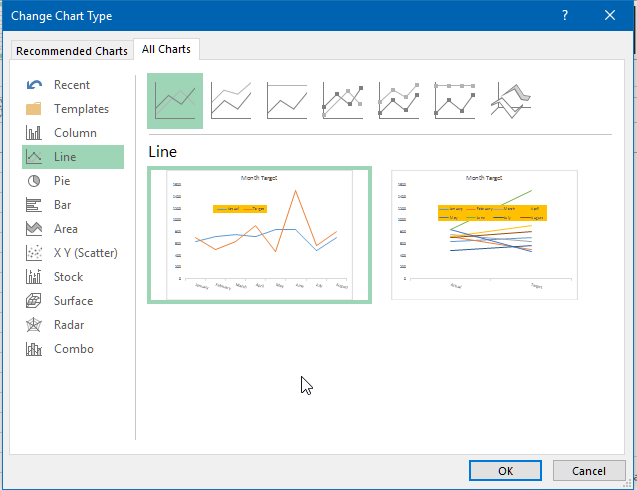
'Change Chart Type' dialog box appears.

Select any chart from left panel on the dialog box and then select it's variance from top. Clicking OK displays the chart in that format. For this example, Line chart.
Switch Row/Column in chart
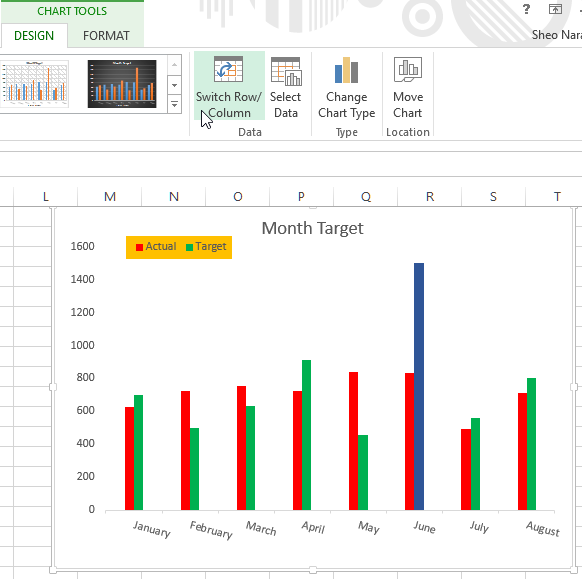
To swap the axis data (X axis data to Y and Y axis data to X), select 'Switch Row/Column' command from 'DESIGN' menu.

and the axis data is swapped that shows the above chart like this.
Hope you liked this article, do not forget to share and subscribe!
Views: 7001 | Post Order: 42


