 Online: 18642
Excel > Functions
Statistical functions in Excel
How to calculate Average, AverageIf, Median, Large and Small value in Excel?
In previous post, we learnt how to calculate different types of depreciation in MS Excel. In this post, we shall learn how to work with statistical functions in MS Excel.
AVERAGE function
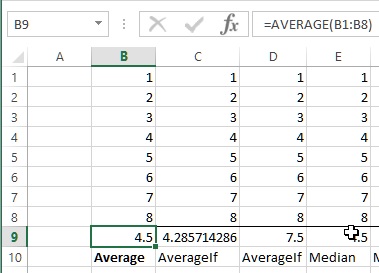
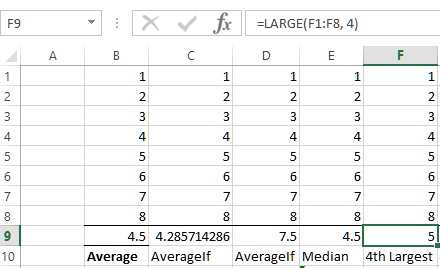
AVERAGE function is used to calculate average of the range of given cells. In below example, B9 cell contains '=AVERAGE(B1:B8)' formula that gives average of B1 to B8 cell values.
AVERAGEIF function
AVERAGEIF function also gives the average of the range of cells however we can specify a condition as 2nd parameter/argument.
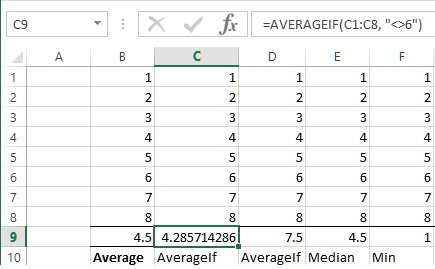
C9 cell contains '=AVERAGEIF(C1:C8, "<>6")' formula that calculates average of cells value between C1 and C8 only if the cell value is not equal to ('<>') 6. It means this funciton sums all cells value except B6 and divide by 7 (ignores B7 cell in the count).
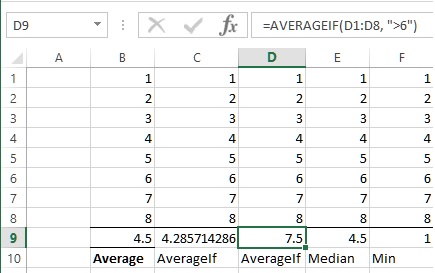
Similarly, the 2nd parameter can also be greater than ('>') or less than ('<'). D9 cell contains '=AVERAGEIF(D1:D8, ">6")' formula that calculates the average of only D7 and D8 cells.
MEDIAN function
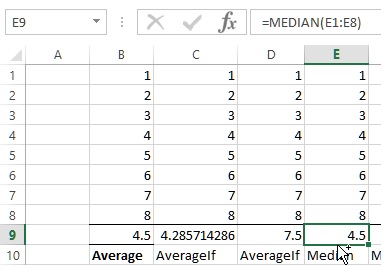
MEDIAN function is used to find the median value within a given range of cells. E9 cell contains '=MEDIAN(E1:E8)' formula that calculates median of E1 to E8 cell values.
LARGE function
LARGE function is used to find the nth largest value from the given range. F9 cell contains '=LARGE(F1:F8, 4)' formulat that gets the 4th largest value from F1 to F8 cell values. Largest values are calculated in descending order.
SMALL function
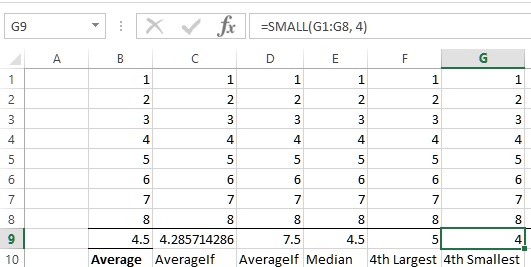
SMALL function in Excel is used to find the nth smallest number from the given range. G9 cell cotnains '=SMALL(G1:G8, 4)' formulat that gives the 4th smallest number from G1 to G8 cell value. Smallest number is found in asecnding order.
Thanks! If this helped, please let your friends and colleagues know about this.
Views: 6488 | Post Order: 37


